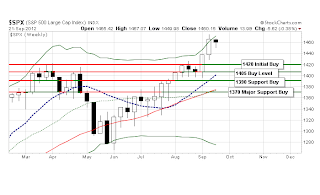
However much I want to believe that it is a top and the road
is down, I am not jumping the gun yet. Yes it is topping but even with this 1%
drop (wow!) (how come Ben?) we do not have the sell signal yet. Remember that
chart of Presidential Election Cycle from Bespoke? Here it is for your ready
reference:
So it is just about time for a correction. Whether it will be 3% -5% correction or 10% +
correction, we will have to wait and see. As of now it is a warning shot. The
line in the sand /ES 1445 has been broken. The indexes opened high, reached
higher and closed in red, which means that more correction ahead. It need not
be tomorrow though because SPX has 4 red days in a row and a bounce is due.
Yesterday I wrote that we will see a test of the high today
and a top is near. We did see SPX reach 1462.80 before selling off. So it is on
script.
In the morning I tweeted that all the asset classes are
selling in sync. But when the indexes dropped hard in the last two hours, oil,
gold and silver did not budge much. May be gold and silver will sell off in the
Asian session , so I am willing to wait a while longer to decide if the
sell-off is real or it’s a head fake. In all probabilities, we will see a
bounce in the next few days.
I want to share a chart from Lance Roberts:
Lance thinks that any correction here is a buying
opportunity and I somewhat agree with him, at least till election. I would love
the indexes do a dead cat bounce, re-test the high in the next few days or so
and roll over 100 SPX points, but that’s just wish full thinking.
Euro is hanging around 1.29 levels and it has already made
three attempts to break below and have bounced from there. Will 3rd
time be the charm? If it breaks from
here the next level is 1.2750 and it will take equities along with it.
The Euro position in the latest COT report shows that
commercials are still net long Euro by almost 3 times.
However, the long for the last week has come down to 140 k
from 230 k. which is almost 40% drop in the long position in one week and that
indicates that the commercials may be winding down their long position. We will
keep an eye on this one. If you remember, in the past I had repeatedly
mentioned that commercials are long Euro and all talks of Euro disintegration
is just talk, at least for now.
Bonds gave a buy signal and their bounce seems to be more
serious kind of bounce. From $132 in end
of July, TLT came down to $118 on 14th Sept. It has now bounced back
to $ 123. I think it will re test the high one more time before the boom is
over.
Thanks for sharing my thoughts. Join me in twitter for the
real time market action and to avoid head fakes (@BBFinanceblog). By the way,
the blog now has a “ Donate” button and your contributions will be my stimulus package.


Jeff Cooper: If September 13/14 remains the high and downside momentum picks up, it's interesting that the Gann Crash Zone ties to election day
ReplyDeletehttp://twitter.com/jeffcooperlive
More than $4bn was spent on the presidential and congressional candidates and campaigns in the first 18 months of the election cycle, according to the Federal Election Commission. Different indicators point to different directions. The breadth thrust buy signal, one of our favorite market indicators, tells us that the odds favor the bulls in the coming months. But the history of the cycle composite suggests that a pullback over the next month or so would be in keeping with historical trends. I would love the indexes do a dead cat bounce, re-test the high in the next few days. Obama’s Victory Speech also was similar in construction to his 2004 Democratic Convention address, which first brought him to widespread national attention. Marketing Research Report
ReplyDelete